Company Name : Salesforce.com, Inc.

What a trading day it was yesterday! The Dow dropped 700+ points on negative news on trade. China is retaliating to President Trump's tariffs. Now we are in a situation where equities are under an enormous pressure. Looking at the August 5, 2019 1-year chart of $CRM above, the market now has pulled back the price to the January highs when Salesforce broke out early of this year. We are now back to only about 1.30% up year-to-date and all gains this year, have now been taken back by the market. Further erosion of confidence can push the price down to its December lows. Fear is in the air. I am waiting and watching for now.
Technical Analysis: Major Support (SMA200)
Sector / Industry: Technology / Software - Application
STOCK UPDATES:
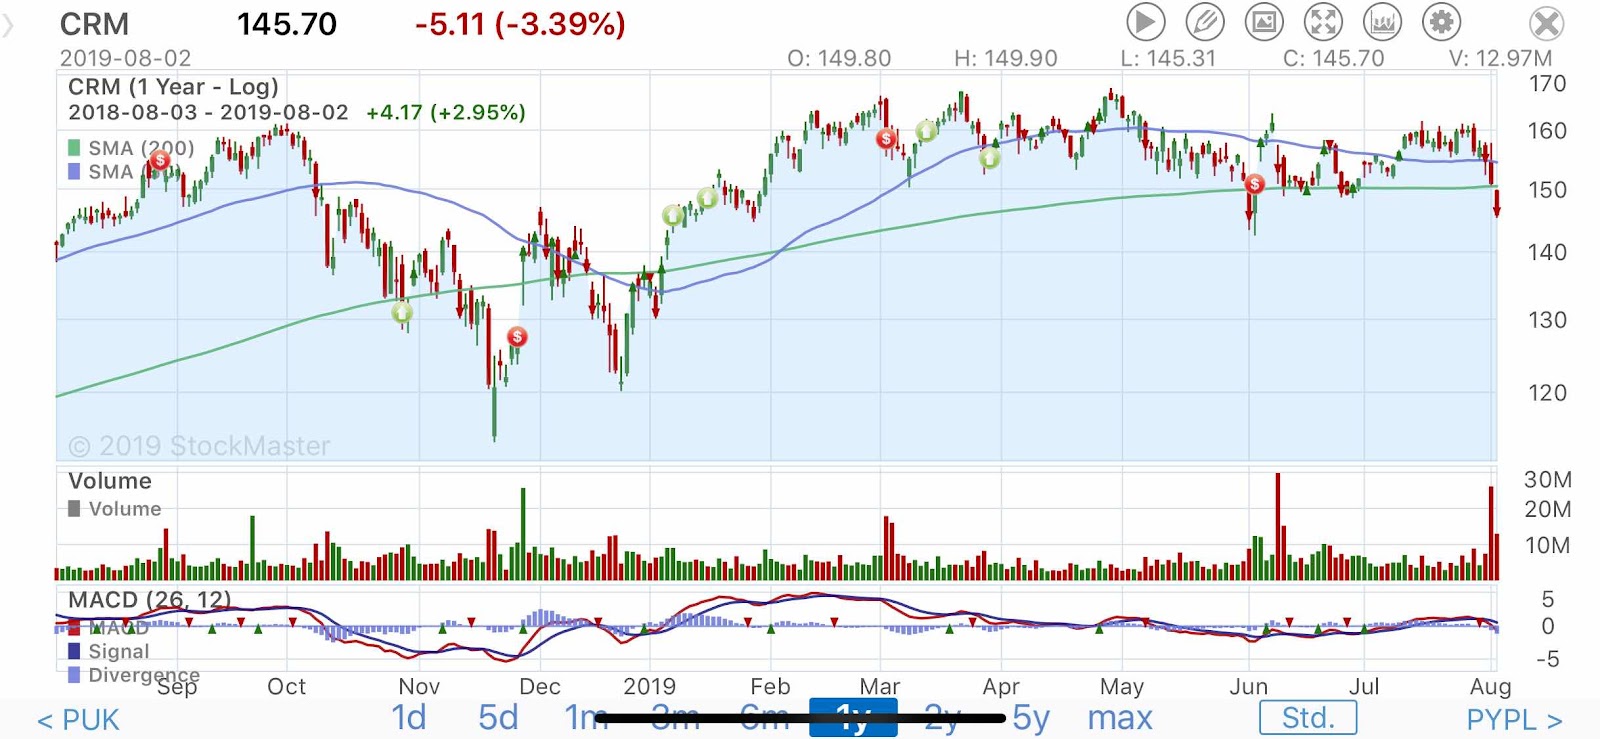
August 5,2019 (1 Year Chart, SMA50 Blue, SMA 200 Green)
What a trading day it was yesterday! The Dow dropped 700+ points on negative news on trade. China is retaliating to President Trump's tariffs. Now we are in a situation where equities are under an enormous pressure. Looking at the August 5, 2019 1-year chart of $CRM above, the market now has pulled back the price to the January highs when Salesforce broke out early of this year. We are now back to only about 1.30% up year-to-date and all gains this year, have now been taken back by the market. Further erosion of confidence can push the price down to its December lows. Fear is in the air. I am waiting and watching for now.
August 3,2019
Technical Analysis: Major Support (SMA200)
Based on the one year chart shown above, Salesforce.com Inc. $CRM is now trading below its major support, the 200 day Simple Moving Average (SMA200). The last time $CRM stock price got under pressure was around June/July period where price barely tiptoed above its major support. During the last six months, Salesforce.com's price has now been in a $150-$160 range and with the recent US-China trade woes and interest rate cut by the Fed, it appears like the stock price might feel the same downward pressure it went through in December 2018.
MY CURRENT STRATEGY:
I hold Salesforce.com, Inc. $CRM in my IRA and I plan to increase my current position with small buys everytime it goes red. I think the company is well managed with good upside so I will buy and hold.
IMPORTANT DISCLOSURE:
This is not a trading or investment recommendation to buy, hold, or sell $CRM. I am not paid by anyone for this blogpost.
Tags
Free stock market chart pictures
investing
investments
Large Cap
Stock Charts
Stock Market
Stock Picks
Stock tickers
Stock Trading